How Basic Mathematics Can Transform Your Retail Distribution Network
Distribution is retail has taken a new life post the rise in consumer demand across developing markets. Territorial mapping and analytics has infused the waning sector with vigor and ambition. What seemed liked the peak, turned out to be the tip of the iceberg. With these transformations, retail can finally automate its distribution in terms of planning, execution, and optimization.
But did you know, even with basic mathematics, you can boost your retail sales by more than 30%?
It’s simple! Distribution is a means to reach your end-customer in the most optimal way possible. It’s reaching the right customer with the right product, at the right time, and in the right place. Retail distribution is a factor of multiple moving parts, one of which is the placement of its stores. Before we begin, let’s understand some basic terminology in retail distribution planning.
Numerical Distribution
Numerical Distribution is the unilateral distribution showing the total retail stores occupying the company’s products. It is essential the quantitative assessment of the distribution. If you have 10 stores in the locality, a company selling its products through 3 of those stores would have 30% numeric distribution.
Weighted Distribution
Suppose, out of these 10 stores, top three 3 stores sell 80 % of the total merchandise. If a company sells its products through these 3 top selling stores, then it would mean it available to 80% of the market. This is weighted distribution. It is essentially the qualitative assessment of the distribution.

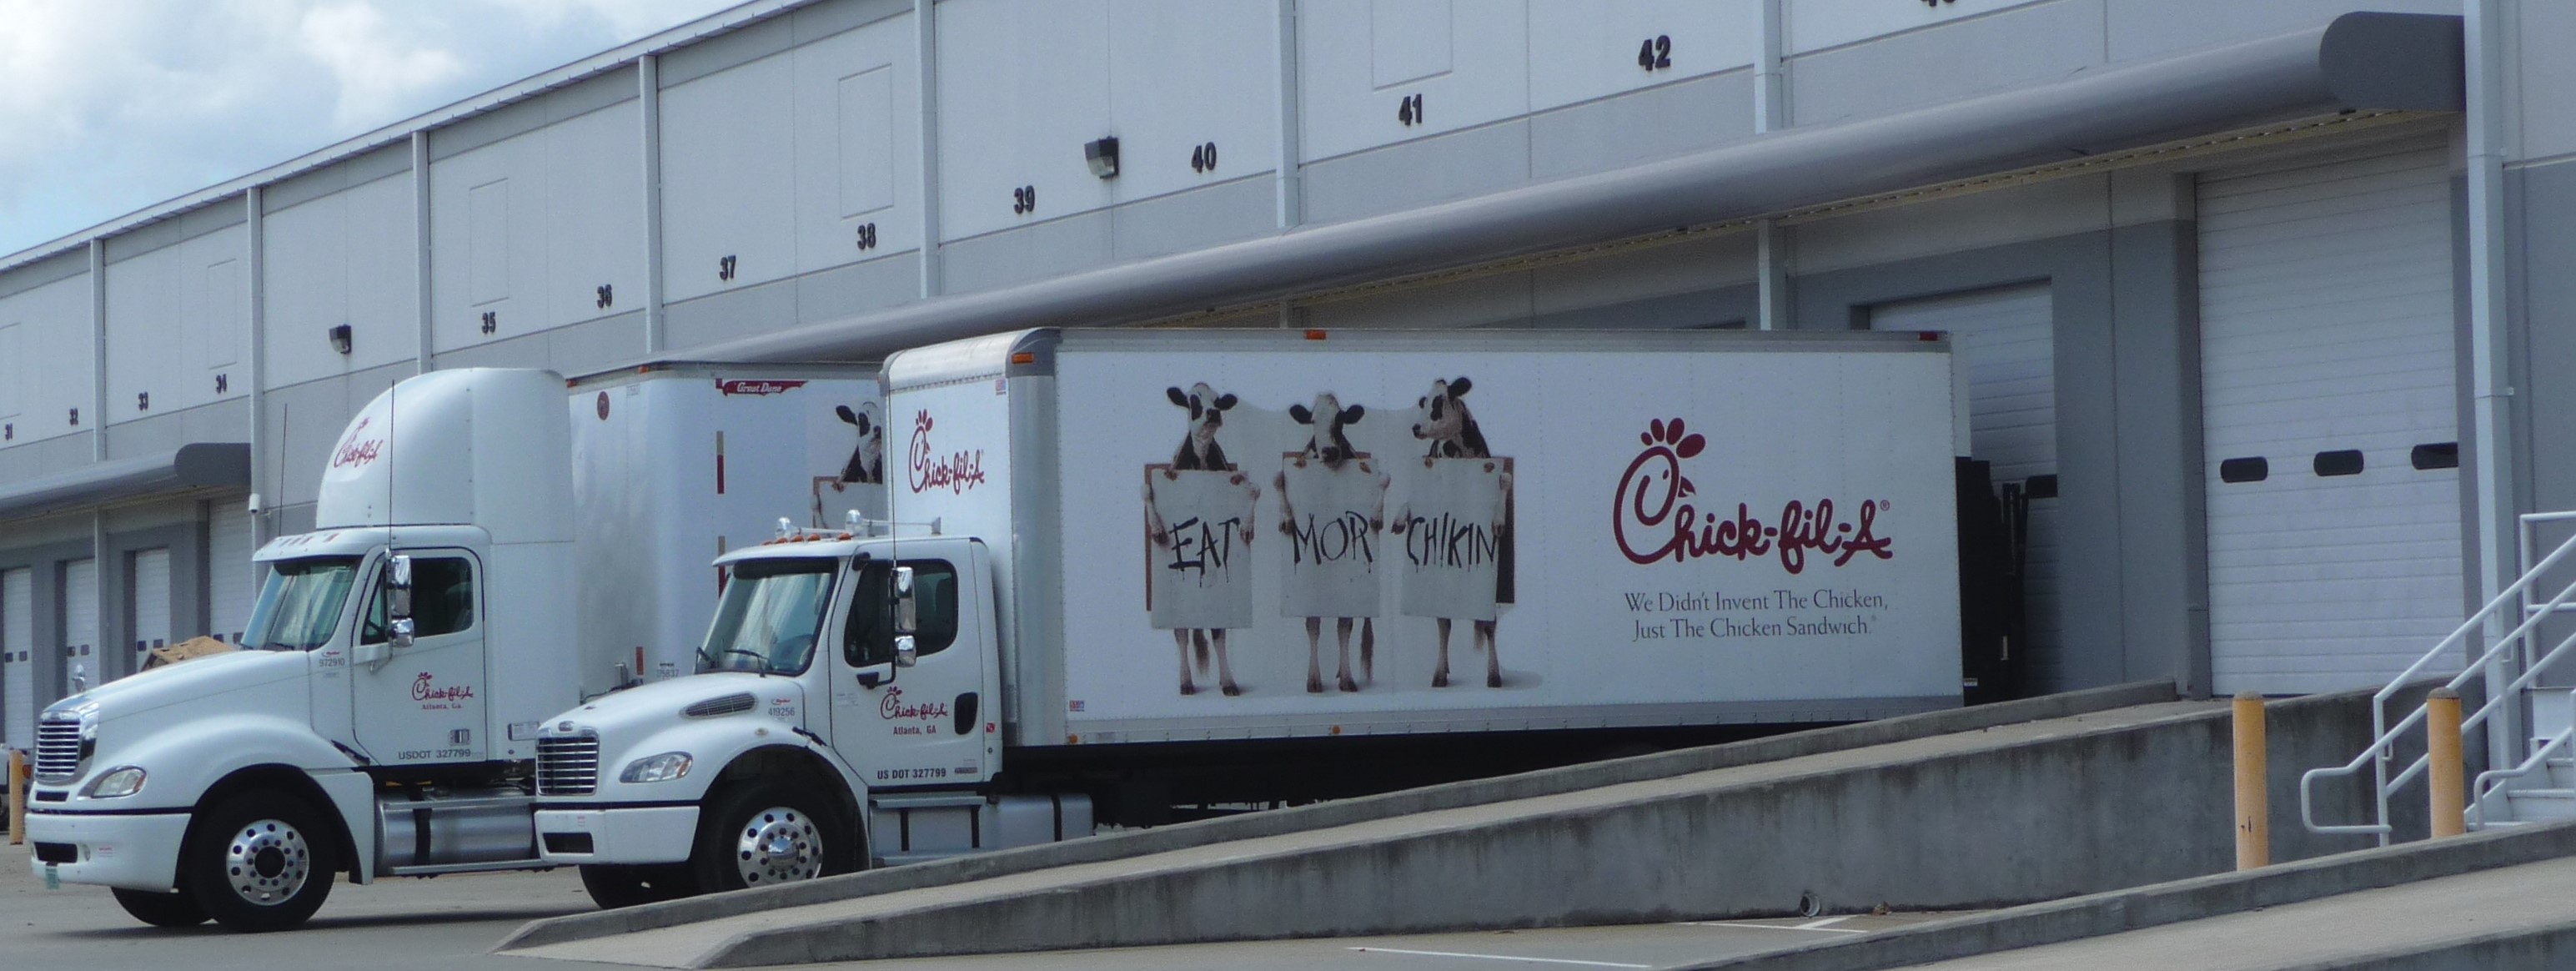
Logistics Distribution Network for Fresh Foods
Multi-Modal Distribution
Progressive hub and spoke model of distribution with multiple nodes or supportive/sustaining points in the network. Retail distribution functions through such multi-modal distribution to maintain just-in-time inventories and a lean replenishment system.
Probabilistic Distribution
Assigning the probabilistic function of 1 (the likelihood of an event occurring is complete), to the mother store (the biggest store in the territory), and planning the resultant inter-store distribution and replenishment system as per the deviation from this function (decreasing likelihood of an event occurring) can help in establishing resource and logistics requirements across the supply chain.
Generalized Extreme Value (GEV) Distribution
This not so basic tool of mathematics functions on the truly basic and formative logic of probabilistic distribution when you consider random or extreme values. Extreme values are those that differ largely from the median. These extreme values are truly random and must be analyzed for possible latent pockets of demand in nascent retail markets.
The first three principles, as you noticed, are easier to comprehend. The forth is simple and direct, and historical statistics can enable retail chains to plan their logistics better. The fifth is more dynamic, and requires a machine learning enabled planning engine to account for the millions of variable data points covering the different retail distribution networks in small and big cities.
This is where LogiNext stands apart from the rest. The clients can have comprehensive reports with glowing insights (from our predictive analytics engine) on possible expansion and optimization opportunities.
189 1


Pingback: Sonya_t | Pearltrees